
Mean Half Time To Infection
How infectious is your community, really?

After the initial outburst of a covid19 epidemic, the period of exponentially rising cases and deaths, there came the ‘flattening the curve’. And now, small, incremental changes in case rates and death rates.
Governments are ordering their citizens about with a confusing array of behaviors. Re-opening, but only at 20% capacity. No, make that 50% capacity, but for restaurants, while theaters must be 10% capacity. Lock-down, but there’s no law against going out. Gyms are open. Bars are not open. Stay 2 meters away in parks, or we will slap you $1000 fine. We’re re-opening elementary schools! We’re not re-opening high schools. Do not visit your grandparents! Stay at home and never leave.
These restrictions are meant to modify behavior, to save lives. What people don’t get from them, is an understanding of what they most want to know:
How ‘at risk’ am I, today, of getting infected with coronavirus? How does this compare with risks elsewhere?
That question can be approximately answered, for an average person in a given population, if you know what the daily number of new infections are, and the total population (call them “N” and “P”, respectively). With those two pieces of information, N/P is the probability for an average person to become infected in a day, under the present conditions in the population.
Likewise, its inverse — P/N— tells you a timescale, which approximates the number of days by which an average person in a population would become infected.
Slightly more useful is to use 1/2 * P/N — the mean half-time to infection for an average person, i.e. the amount of time which must elapse for an average person to accrue a 50% probability of becoming infected. More importantly, this is also the amount of time over which half the population will become infected.
But how to calculate this? To do so, we must use available data - such as the Daily New Cases, and the Daily New Deaths.
Using Daily New Case Rates
To address this question, I use quick-and-dirty approximation to answer the question, only as accurately as information provided by health authorities: the daily new cases, and the daily new deaths.
The calculation works like this. Let’s say your community of P=1,000,000 people has a daily new cases of C=30 new cases per day. At this rate, what is the amount of time which must pass, before a random person in that population becomes a “case”?
Well, first, the probability that a random person is infected on a given day, (assuming the will be 30 new cases per day/1M people=C/P=0.00003 per day — about 0.003% per day. Each day, for a random person, the probability adds, 0.003% on day 1, plus 0.003% on day 2…. on upwards to 50% - at which point, a random person drawn from the population has a 50/50 chance of having been infected with coronavirus.
Of course, some people are infected with coronavirus, and their infection never rises to a clinical level, requiring DNA testing for confirmation, and, when such testing comes back positive, becoming a “case”. Estimates for the the number of infections per case (I) vary, but a typical number bandied about, is I=10. That is the number I adopt here.
Using a value for C, I, and P, one can calculate a Mean Half-Time to Infection (Y) as described below.
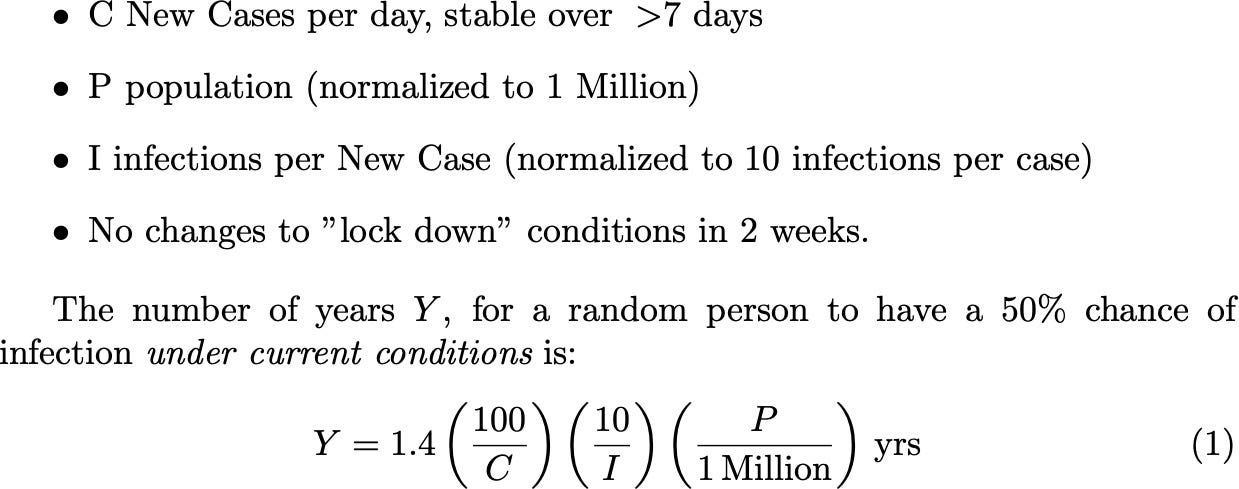
There are huge caveats that go along with this calculation of Y, including:
The time delay between infection and when a case becomes clinical, median, is about 1 week. So, this Y is appropriate to conditions 1 week ago - and not today.
It’s well known that C varies day to day in some health systems, apparently due to statistics not being reported on Saturday or Sundays (and then being reported on Monday or thereafter). Thus, it’s a best practice not to use a daily C, but to average C over a 7-day period.
The value of I is highly uncertain, and may vary from population from population. If I is 50% uncertain, this results in a 50% uncertainty in Y.
Because Daily New Cases (C) are sometimes reported only during the week (and not on weekends), it is better to use an average Daily New Case Rate taken from the most recent 7 days, to average over the different days of the weeks.
Be aware, that when the case rates are very small, the fractional uncertainties can become large. Thus, statistically, you only get 1 significant digit, at best, in averaging up to 100 cases (not per day, but total), and only 2 significant digits when averaging more than 10,000 cases (most populations don’t produce 10,000 cases in a week, so most calculations of Y will be even approximately correct at 1 significant digit), with dominant uncertainties due to uncertainty in I.
The uncertainties in C and I can be significant, and these lead to a subsequent uncertainty in Y. Many of the flaws of using the Daily New Case for this, are avoided by using the Daily New Deaths Rate - although, that has its own flaws, which we now discuss.
Using Daily New Deaths
Another way to get the daily infection rate, is to use the Daily New Deaths (Fatalities) Rate (X). In principle, the Daily New Deaths is proportional to the infection rate -delayed, by about 25 days, which is the median time between infection and fatality, for fatal cases of covid19. The constant of proportionality — the number of deaths per infection, or the Infection Fatality Rate (R) — depends on factors like the demographic distribution of the population of conditions which contribute to mortality (like disability, or age); and access to healthcare. This value has been estimated in the scientific literature to be about R=0.66%, with uncertainties of a factor of 2 (as high as 1.3%, down to 0.33%). I adopt a value R=0.66%.
Using a value for X and R, and the population P, one can calculate a Mean Half-Time to Infection (Y) as described below.
Similar to the caveats in the the calculation of Y using Daily New Cases, this calculation has caveats:
R may be uncertain by a factor of 2 (as high as 1.3%, as low as 0.33%), and so dominates the uncertinty in Y.
It is difficult to ascertain if the infection rate calculated by X/R is more or less accurate than C*I - it may be that the Daily New Cases are grossly underestimated in a population due to constraints on testing, in which case Daily New Deaths X may be a more accurate estimation of the infection rate. In practice, it is probably useful to calculate Y using both methods, over a range of days and to compare how the values evolve in time.
Let’s take a look now at applying this calculation to Switzerland.
Example: An Application to Switzerland
I’m applying this calculation to Switzerland as an example, because - as can be seen in the figure below showing the Daily New Deaths (averaged over the trailing 7 days), it had a rapid onset of the epidemic, as is typical, and then successfully arrested the epidemic through public health interventions, and now has mostly recovered, and returned to “re-opening”.
Although the number of new fatalities after May 31 is a relatively low number, as are the Daily New Cases, is this re-opening safe?

We used data for C and X from the Wikipedia database, and adopt the values for I and R given above. With this, we calculated Y, the mean half time to infection, using both techniques of Fatalities (blue line) and Cases (red line), as a function of time between the second week of March 2020 into the first week of June.

It’s important to note that the Y (mean half-time to infection) measured from X (fatality rate - blue line) is a lagging indicator of the infection rate - approximately 20-25 days, since the mean time from infection to fatality is approximately 20-25 days. Similarly, the Y measured from C (cases rate - red line) is a lagging indicator of the infection rate by approximately 6 days. For Switzerland’s Y (above) see that before April 5, the red line is similar to the blue line, shifted by about 14 days. This is consistent with the infection rate on day 0 resulting in an observed new cases rate on day 6, and a New Deaths Rate on day 6+14=20.
First, we notice early on in the epidemic (before April 5), there is a large difference in Y, with that calculated from X being larger than that from C, by almost a factor of 10. This is likely due to the fact that X is a trailing indicator of the infection rate, by ~20 days, while C is a trailing indicator of the infection rate by only ~6 days. While the number of infections, therefore, is exponentially climbing before April 5, the value of Y calculated with C is lower, because the infection rate was much lower (by a factor of ~10, according to this calculation) ~20 days ago, than it is ~6 days ago.
Second we notice that the two calculations for Y cross over near April 5 - about the time the number of fatalities peak. This is the point when public health interventions apparently caused the infection rate to drop. From that point, the value of Y calculated from C is higher, since (as the infection rate is presumably dropping) it is more recently measured than the value of Y from X (i.e. ~6 days ago, instead of ~25 days ago) and as a result, it measures a lower infection rate, and so a longer mean half-time to infection Y. During this part, the two values of Y differ by about a factor of 2, indicating that the infection rate is lower by a factor of 2 ~six days ago than it was ~25 days ago.
Finally, we look at the number. Early in the epidemic, when the infection rate is lowest, Y is the longest - 50 years - and dropping down to <1 year during the period After about May 31, the mean half-time to infection Y appears to be about 50 years.
Switzerland had a Y<2 years (very short mean half-time) between about March 11-April 3; after the peak in infections, it had 2<Y<10 years (medium half-time) between April 4-21; and Y>10 years (long half-time) after about April 28.
While these dates are all in the past, using calculations like this one, one can estimate, using the 7-day Average Daily New Cases, and 8-day Average Daily New Deaths, to estimate how infectuous a given population is - keeping in mind, importantly, that the Y calculated using New Cases is delayed by ~6 days from what it is measuring; that the Y calculated using New Deaths is delayed by ~20 days from what it is measuring; and that both these numbers have uncertainties range from about +/-50% (Y from New Cases) to a factor of 1/2-2x (Y from New Deaths).
Questions we should be asking public officials, in light of all this:
What is the Mean Half-Time to Infection for our community, and how did you calculate it?
How is the Mean Half-Time to Infection being used in making decisions about opening/re-opening/re-entry?
EDIT added June 9 2020: Nigel Goddard has added the MHTI to his webtool. . Also, thank you to Nigel Goddard for correcting the following errors: Previously, a percentage was mistakenly written as 0.03%, which should have been 0.003%.